1. Introduction & Overview
What is Resource Utilization?
Resource Utilization in DevSecOps refers to the efficient allocation, management, and optimization of computing resources—such as CPU, memory, storage, and network—to support the development, security, and operations processes. It ensures that infrastructure and tools are used effectively to maximize performance, reduce costs, and maintain security while delivering software rapidly and reliably.
History or Background
The concept of resource utilization has evolved alongside advancements in cloud computing and DevSecOps practices. In traditional IT environments, resources were often over-provisioned, leading to wasted compute power and high costs. The rise of cloud-native technologies, containerization (e.g., Docker, Kubernetes), and continuous integration/continuous deployment (CI/CD) pipelines introduced dynamic resource allocation. DevSecOps further integrates security into this process, ensuring resources are optimized without compromising on vulnerability management or compliance.
Why is it Relevant in DevSecOps?
Resource utilization is critical in DevSecOps for several reasons:
- Cost Efficiency: Optimized resource use minimizes cloud and infrastructure expenses.
- Performance: Proper allocation ensures applications perform well under varying workloads.
- Security: Efficient resource management reduces attack surfaces, such as unused virtual machines or misconfigured containers.
- Agility: Dynamic scaling supports rapid development and deployment cycles, aligning with DevSecOps’ focus on speed and collaboration.
2. Core Concepts & Terminology
Key Terms and Definitions
- Resource Allocation: Assigning compute, storage, or network resources to specific tasks or applications.
- Auto-scaling: Automatically adjusting resources based on demand, e.g., AWS Auto Scaling or Kubernetes Horizontal Pod Autoscaler (HPA).
- Container Orchestration: Managing containerized workloads using tools like Kubernetes or Docker Swarm.
- Resource Monitoring: Tracking resource usage with tools like Prometheus, Grafana, or cloud-native solutions (e.g., AWS CloudWatch).
- Cost Optimization: Balancing performance and cost using tools like AWS Cost Explorer or Azure Cost Management.
| Term | Definition |
|---|---|
| CPU Throttling | Limiting CPU usage when resource quotas are exceeded |
| Memory Leaks | Failure to release memory, often identified via utilization monitoring |
| Auto-scaling | Dynamic adjustment of resources based on utilization |
| Overprovisioning | Allocating more resources than needed, leading to waste |
| Underutilization | Allocated resources are idle or not used efficiently |
| Anomaly Detection | Identification of abnormal usage patterns, often using machine learning |
| Rightsizing | Optimizing resource allocation based on historical usage |
How it Fits into the DevSecOps Lifecycle
Resource utilization is integral to every phase of the DevSecOps lifecycle:
- Plan: Estimate resource needs for development, testing, and production environments.
- Code: Use lightweight integrated development environments (IDEs) and containers to minimize resource overhead.
- Build: Optimize CI/CD pipelines to reduce compute time, e.g., by caching dependencies.
- Test: Allocate resources for security scans (e.g., Static Application Security Testing [SAST] or Dynamic Application Security Testing [DAST]) without overloading systems.
- Deploy: Use auto-scaling to handle production traffic efficiently.
- Operate/Monitor: Continuously monitor resource usage to detect inefficiencies, anomalies, or security issues.
3. Architecture & How It Works
Components
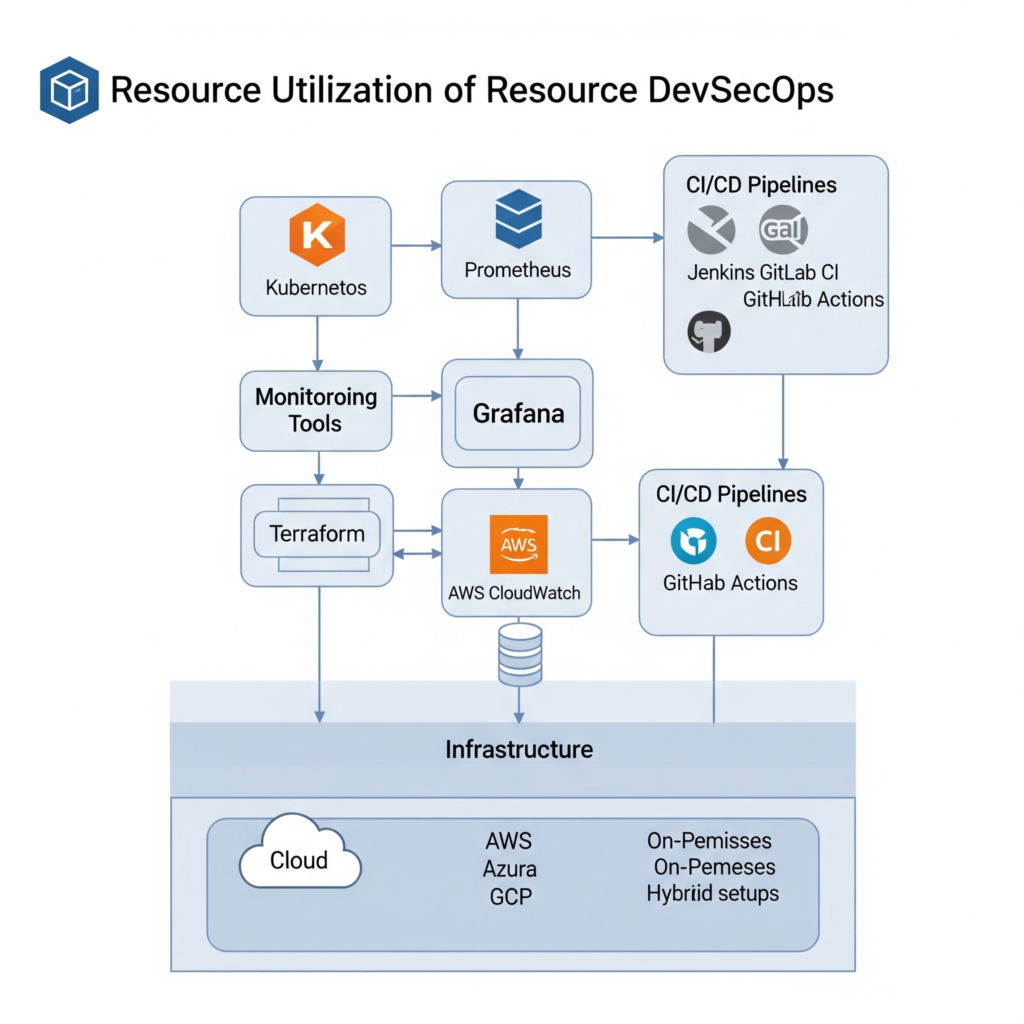
Resource utilization in DevSecOps involves several key components:
- Infrastructure: Cloud platforms (e.g., AWS, Azure, GCP), on-premises servers, or hybrid setups.
- Orchestration Tools: Kubernetes for container management, Terraform for Infrastructure as Code (IaC).
- Monitoring Tools: Prometheus for metrics collection, Grafana for visualization, or cloud-native solutions like AWS CloudWatch.
- CI/CD Pipelines: Tools like Jenkins, GitLab CI, or GitHub Actions for automated workflows.
Internal Workflow
The typical workflow for resource utilization includes:
- Provisioning resources using IaC tools like Terraform.
- Deploying containerized applications via Kubernetes.
- Monitoring resource usage in real-time with Prometheus or similar tools.
- Applying auto-scaling rules based on metrics, e.g., scaling up when CPU usage exceeds 80%.
- Running security scans to ensure resources are not misconfigured or vulnerable.
[Application] --> [Resource Monitor/Agent] --> [Metrics Backend] --> [Analyzer] --> [Dashboard + Alerts + Automation]
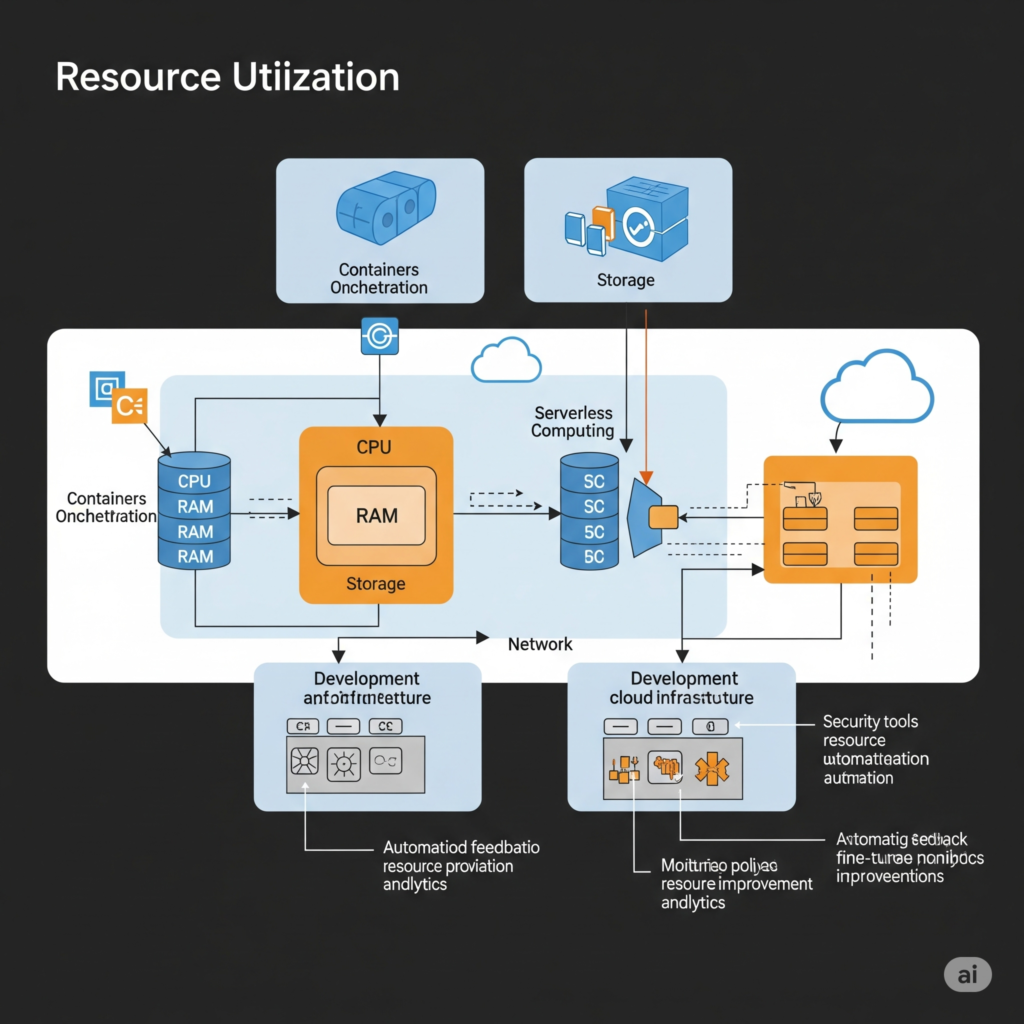
Architecture Diagram Description
The architecture consists of a Kubernetes cluster with multiple nodes hosting containerized applications. Prometheus monitors resource metrics (e.g., CPU, memory) and feeds data to Grafana for visualization. CI/CD pipelines (e.g., Jenkins) deploy applications, while auto-scaling rules adjust resources based on demand. Security tools, such as Aqua Security or Trivy, scan containers for vulnerabilities. The system integrates with cloud services for storage, networking, and additional monitoring.
Integration Points with CI/CD or Cloud Tools
Resource utilization integrates with:
- CI/CD Pipelines: Optimize build and test stages to reduce compute time, e.g., by caching dependencies or parallelizing tasks.
- Cloud Tools: AWS Auto Scaling, Azure Monitor, or Google Cloud Operations Suite for dynamic resource management.
- Security Tools: Integrate with Snyk or Trivy for container scanning within CI/CD workflows.
| Tool | Integration Purpose |
|---|---|
| Jenkins | Monitor CI job runners’ CPU/memory during builds |
| GitHub Actions | Check resource consumption in workflows via runners |
| Kubernetes | Resource quota enforcement, auto-scaling |
| AWS/GCP/Azure | Resource tagging, monitoring with CloudWatch/Stackdriver |
| Falco | Alerts on suspicious usage patterns |
4. Installation & Getting Started
Basic Setup or Prerequisites
To set up a resource utilization pipeline in a DevSecOps environment, you need:
- A cloud account (e.g., AWS, Azure, or GCP) or local infrastructure.
- A Kubernetes cluster (e.g., AWS EKS, Azure AKS, or minikube for local testing).
- Monitoring tools like Prometheus and Grafana.
- A CI/CD tool, such as Jenkins, GitLab, or GitHub Actions.
- Basic knowledge of containerization and IaC.
Hands-on: Step-by-Step Beginner-Friendly Setup Guide
- Set Up a Kubernetes Cluster (using minikube for local testing):
   # Install minikube
   curl -LO https://storage.googleapis.com/minikube/releases/latest/minikube-linux-amd64
   sudo install minikube-linux-amd64 /usr/local/bin/minikube
minikube start- Install Prometheus for Monitoring:
   # Add Prometheus Helm repository
   helm repo add prometheus-community https://prometheus-community.github.io/helm-charts
helm install prometheus prometheus-community/prometheus- Configure Auto-scaling (using Kubernetes Horizontal Pod Autoscaler):
   # Create an HPA for a deployment named 'my-app'
kubectl autoscale deployment my-app --cpu-percent=80 --min=1 --max=10- Set Up a CI/CD Pipeline (using GitHub Actions as an example):
   # Example GitHub Actions workflow file (.github/workflows/ci-cd.yml)
   name: CI/CD Pipeline
   on: [push]
   jobs:
     build:
       runs-on: ubuntu-latest
       steps:
       - uses: actions/checkout@v3
       - name: Build and Push Docker Image
         run: |
           docker build -t my-app .
           docker push my-app
This setup provides a basic environment for resource utilization, with Kubernetes managing containers, Prometheus monitoring resources, and a CI/CD pipeline automating deployments.
5. Real-World Use Cases
Scenario 1: E-commerce Platform
An e-commerce platform uses Kubernetes with auto-scaling to handle traffic spikes during sales events (e.g., Black Friday). Prometheus monitors CPU and memory usage, triggering scaling when thresholds are exceeded. Security scans with Trivy ensure containers are free of vulnerabilities, maintaining a secure environment during high-traffic periods.
Scenario 2: Financial Services
A bank optimizes its CI/CD pipelines to reduce build times by caching dependencies and parallelizing tests. Resource utilization is monitored to ensure compliance with regulatory standards like PCI-DSS, with alerts for unusual resource consumption that could indicate security breaches.
Scenario 3: Healthcare
A healthcare provider uses AWS Auto Scaling to manage workloads for a patient portal. Resource monitoring ensures HIPAA compliance by detecting unauthorized access or resource overuse, while lightweight containers reduce costs for non-critical workloads.
Scenario 4: Gaming Industry
A gaming company deploys containerized microservices with Kubernetes to support thousands of concurrent players. Resource utilization is optimized to handle peak loads, with security scans integrated into the CI/CD pipeline to prevent vulnerabilities in game servers.
6. Benefits & Limitations
Key Advantages
- Cost Savings: Reduces over-provisioning in cloud environments, lowering infrastructure costs.
- Scalability: Auto-scaling ensures applications handle peak loads efficiently.
- Security: Minimizes attack surfaces by de-provisioning unused resources and scanning for vulnerabilities.
- Efficiency: Optimizes CI/CD pipelines for faster builds and deployments.
Common Challenges or Limitations
- Complexity: Managing Kubernetes, monitoring tools, and auto-scaling requires expertise.
- Initial Setup Cost: Time and resources are needed to configure orchestration and monitoring systems.
- Over-optimization Risk: Aggressive scaling or resource limits may impact application performance.
7. Best Practices & Recommendations
Security Tips
- Apply the principle of least privilege for resource access, e.g., using AWS IAM roles or Kubernetes RBAC.
- Regularly scan containers for vulnerabilities using tools like Trivy or Snyk.
Performance
- Implement caching in CI/CD pipelines to reduce build times (e.g., caching Docker layers).
- Use lightweight container images (e.g., Alpine-based images) to minimize resource usage.
Maintenance
- Regularly update monitoring dashboards to reflect current resource usage patterns.
- Automate resource cleanup (e.g., deleting unused containers or VMs) to prevent waste.
Compliance Alignment
- Align with standards like GDPR, HIPAA, or PCI-DSS by monitoring resource access and logging.
- Use tools like OpenSCAP to automate compliance checks.
Automation Ideas
- Use Infrastructure as Code (IaC) tools like Terraform for reproducible infrastructure.
- Automate scaling with Kubernetes HPA or cloud-native auto-scaling solutions.
8. Comparison with Alternatives
| Feature | Kubernetes + Prometheus | AWS Auto Scaling | Manual Scaling |
|---|---|---|---|
| Automation | High (HPA, auto-scaling) | High (cloud-native) | Low |
| Cost Efficiency | High | High | Low |
| Complexity | High | Medium | Low |
| Security Integration | Strong (e.g., Trivy) | Moderate | Weak |
When to Choose Resource Utilization with Kubernetes + Prometheus
- Choose Kubernetes with Prometheus for complex, containerized applications requiring fine-grained control and robust monitoring.
- Use AWS Auto Scaling for simpler cloud-native setups with minimal configuration overhead.
- Avoid manual scaling in production environments due to inefficiency and lack of automation.
9. Conclusion
Resource utilization in DevSecOps is essential for balancing performance, cost, and security in modern software delivery. By leveraging tools like Kubernetes, Prometheus, and cloud-native solutions, teams can optimize resources across the DevSecOps lifecycle, ensuring efficient and secure operations. Future trends include AI-driven resource optimization, tighter integration with security tools, and increased adoption of serverless architectures. To get started, explore official documentation for Kubernetes (https://kubernetes.io/docs/) and Prometheus (https://prometheus.io/docs/), and join communities like the Cloud Native Computing Foundation (CNCF) Slack for support and collaboration.