1. Introduction & Overview
What is Showback?
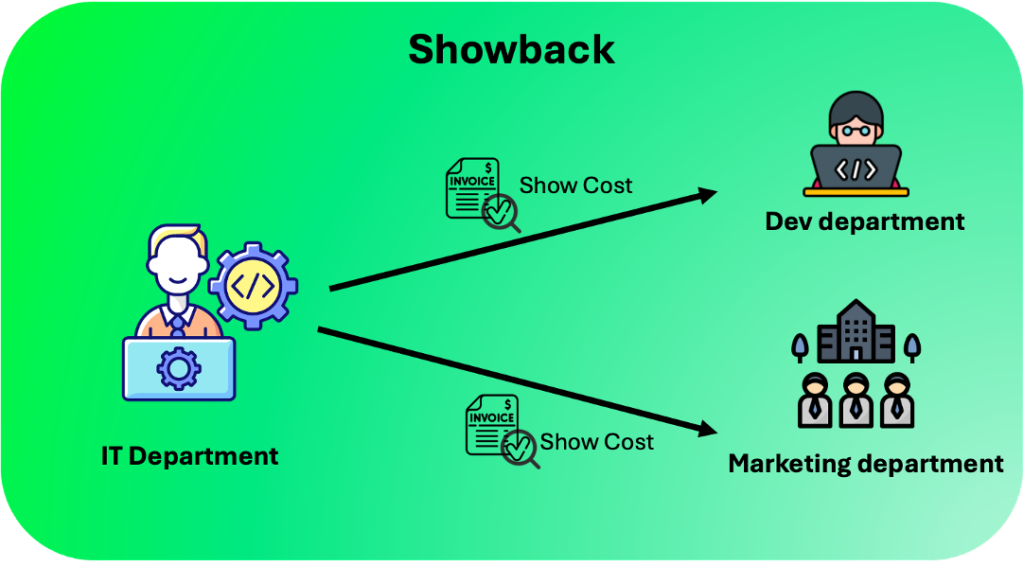
Showback is a financial transparency mechanism used in IT and cloud management to track and report the costs of IT resources consumed by different teams, departments, or projects within an organization. Unlike chargeback, which involves billing internal units for their resource usage, showback focuses on visibility—providing detailed insights into resource consumption without direct financial repercussions. In the context of DevSecOps, showback helps teams understand the cost implications of their development, security, and operations activities, fostering accountability and cost-aware decision-making.
History or Background
The concept of showback emerged as organizations increasingly adopted cloud computing and DevOps practices. As cloud services like AWS, Azure, and GCP became prevalent, IT departments faced challenges in tracking resource usage across distributed teams. Showback evolved from traditional chargeback models used in on-premises IT to address the dynamic, scalable nature of cloud environments. By the mid-2010s, with the rise of DevOps and the need for cross-functional collaboration, showback gained traction as a tool to align development velocity with cost efficiency, particularly in environments prioritizing security (hence, DevSecOps).
Why is it Relevant in DevSecOps?
In DevSecOps, where development, security, and operations teams collaborate to deliver secure software rapidly, showback plays a critical role by:
- Promoting Accountability: Encourages teams to optimize resource usage, such as minimizing unnecessary compute instances or securing cost-intensive processes.
- Enhancing Security Budgeting: Helps allocate security tool costs (e.g., SAST, DAST) to specific projects, ensuring security is prioritized without overspending.
- Supporting Compliance: Provides auditable cost trails for regulatory requirements, aligning with standards like GDPR or HIPAA.
- Driving Efficiency: Enables teams to identify cost-heavy processes in CI/CD pipelines, balancing speed, security, and cost.
2. Core Concepts & Terminology
Key Terms and Definitions
- Showback: Reporting IT resource costs to internal teams without charging them, focusing on transparency.
- Chargeback: A related concept where costs are directly billed to departments, unlike showback’s informational approach.
- Cost Allocation: Assigning costs to specific projects, teams, or applications based on resource usage.
- Cloud Cost Management: Tools and practices to monitor and optimize cloud spending, often integrated with showback.
- Tagging: Labeling cloud resources (e.g., EC2 instances, S3 buckets) with metadata to track usage by team or project.
| Term | Definition |
|---|---|
| Showback | Cost visibility model for IT services without enforcing payment |
| Chargeback | Enforced billing model that requires teams to pay for consumed services |
| Cost Allocation | Method to distribute cloud or IT costs to consuming teams/projects |
| Tagging | Assigning metadata (labels) to cloud resources to enable cost tracking |
| Unit Cost | Cost per unit of compute, storage, scan, etc., useful in DevSecOps context |
How It Fits into the DevSecOps Lifecycle
Showback integrates across the DevSecOps lifecycle, which includes Plan, Code, Build, Test, Release, Deploy, Operate, and Monitor:
- Plan: Teams use showback data to budget for development and security tools.
- Code/Build: Showback highlights costs of development environments (e.g., IDEs, CI servers).
- Test: Tracks costs of testing infrastructure, including security scanning tools.
- Release/Deploy: Monitors deployment-related costs, such as container orchestration or serverless functions.
- Operate/Monitor: Provides insights into production environment costs, including monitoring and incident response tools.
By embedding cost visibility into each phase, showback ensures teams make informed decisions, balancing security and performance with financial efficiency.
3. Architecture & How It Works
Components
- Cost Tracking Tools: Cloud-native tools (e.g., AWS Cost Explorer, Azure Cost Management) or third-party solutions (e.g., CloudHealth, Apptio).
- Tagging System: Metadata tags applied to resources for granular cost attribution.
- Reporting Dashboards: Visual interfaces displaying cost breakdowns by team, project, or application.
- Integration Layer: APIs or connectors linking showback tools with CI/CD pipelines and DevSecOps platforms.
Internal Workflow
- Resource Tagging: Resources are tagged with identifiers (e.g.,
Project:App1,Team:DevSecOps). - Cost Collection: Cloud providers or tools aggregate usage data (e.g., compute hours, storage).
- Cost Allocation: Costs are mapped to tags, creating a breakdown by team or project.
- Reporting: Dashboards generate reports, showing trends and anomalies.
- Feedback Loop: Teams use reports to optimize resource usage, such as resizing instances or reducing idle resources.
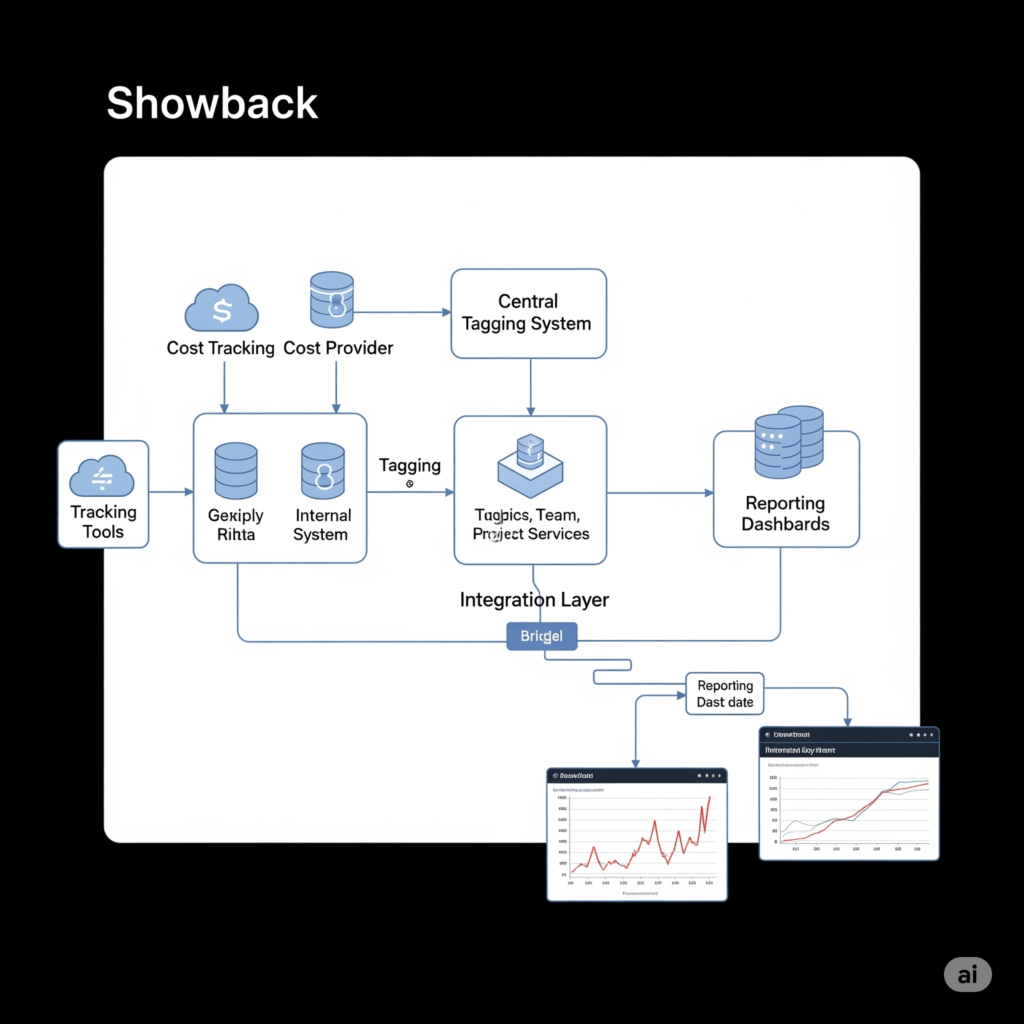
Architecture Diagram Description
Imagine a diagram with:
- Cloud Provider (Bottom Layer): AWS/GCP/Azure providing raw usage data.
- Tagging Layer: Tags applied to resources (e.g., EC2, S3).
- Cost Management Tool (Middle Layer): Processes data, maps costs to tags.
- CI/CD Pipeline (Integration Layer): Jenkins/GitHub Actions with plugins for cost reporting.
- Dashboard (Top Layer): Visualizes costs for DevSecOps teams, with filters for projects or environments.
[ CI/CD Tools ]     [ Cloud Infra ]     [ Security Tools ]
     |                    |                   |
     +--------+-----------+-------------------+
              | Data Collection (via APIs)
              v
        +----------------------+
        |  Cost Analysis Engine |
        +----------------------+
              |
              v
        +----------------------+
        | Dashboards / Reports |
        +----------------------+
Integration Points with CI/CD or Cloud Tools
- CI/CD Pipelines: Plugins like Jenkins Cost Tracker or GitHub Actions integrations pull cost data into pipeline reports.
- Cloud Tools: AWS Cost Explorer, Azure Cost Management, or GCP Billing APIs provide raw data for showback.
- Security Tools: Costs of SAST/DAST tools (e.g., SonarQube, OWASP ZAP) are tracked and allocated.
- Monitoring Tools: Integrations with Datadog or Prometheus include cost metrics alongside performance data.
4. Installation & Getting Started
Basic Setup or Prerequisites
- Cloud Account: Access to a cloud provider (AWS, Azure, GCP) with billing permissions.
- Tagging Strategy: Defined tags (e.g.,
Environment:Prod,Team:SecOps). - Cost Management Tool: A tool like AWS Cost Explorer or CloudHealth.
- CI/CD Platform: Jenkins, GitLab, or GitHub Actions for integration.
- Permissions: IAM roles for accessing billing data securely.
Hands-On: Step-by-Step Beginner-Friendly Setup Guide
This guide sets up showback using AWS Cost Explorer and Jenkins.
- Enable AWS Cost Explorer:
- Log in to the AWS Management Console.
- Navigate to Billing and Cost Management > Cost Explorer.
- Enable Cost Explorer (may take 24 hours to activate).
- Define Tagging Strategy:
- Create tags in AWS Resource Groups > Tag Editor (e.g.,
Project:App1,Team:DevSecOps). - Apply tags to resources like EC2 instances, S3 buckets, or Lambda functions.
- Create tags in AWS Resource Groups > Tag Editor (e.g.,
- Configure Cost Explorer Reports:
- In Cost Explorer, create a report.
- Filter by tags (e.g.,
Team:DevSecOps). - Save the report for regular access.
- Integrate with Jenkins:
# Install Jenkins Cost Tracker plugin
Jenkins > Manage Plugins > Search "Cost Tracker" > Install- Configure the plugin to pull data from AWS Cost Explorer via API.
- Add AWS credentials (IAM role with
AWSBillingReadOnlyAccess).
5. Generate Showback Dashboard:
- In Cost Explorer, export reports as CSV or use API to feed into a custom dashboard (e.g., Grafana).
- Share reports with DevSecOps teams via email or Slack.
6. Test the Setup:
- Run a Jenkins pipeline and verify cost data appears in the dashboard.
- Check if costs are allocated correctly by tags.
5. Real-World Use Cases
Scenario 1: Optimizing CI/CD Pipeline Costs
A DevSecOps team notices high costs in their Jenkins CI/CD pipeline due to oversized EC2 instances. Using showback, they identify that 60% of costs come from idle test environments. They resize instances and implement auto-scaling, reducing costs by 30%.
Scenario 2: Security Tool Cost Allocation
A fintech company uses SAST (SonarQube) and DAST (OWASP ZAP) tools. Showback reports show that the security team consumes 20% of cloud costs. By allocating these costs to specific projects, the company justifies increased security budgets and ensures compliance with PCI DSS.
Scenario 3: Multi-Team Collaboration
A retail organization has multiple DevSecOps teams. Showback reveals that one team’s Kubernetes cluster is overprovisioned, costing $5,000 monthly. The team optimizes resource allocation, saving $2,000 monthly while maintaining security standards.
Scenario 4: Compliance Auditing
A healthcare provider uses showback to track costs of HIPAA-compliant infrastructure. By tagging resources with Compliance:HIPAA, they generate auditable reports, ensuring regulators can verify cost allocations for secure environments.
6. Benefits & Limitations
Key Advantages
- Transparency: Provides clear visibility into resource usage, fostering accountability.
- Cost Optimization: Helps identify and eliminate wasteful spending in DevSecOps workflows.
- Compliance Support: Creates auditable cost trails for regulatory requirements.
- Collaboration: Aligns development, security, and operations teams on cost-aware practices.
Common Challenges or Limitations
- Tagging Complexity: Inconsistent tagging can lead to inaccurate cost allocation.
- Tool Overhead: Setting up and maintaining showback tools requires initial effort.
- Cultural Resistance: Teams may resist cost accountability, fearing it limits innovation.
- Data Overload: Large organizations may struggle to interpret extensive cost reports.
7. Best Practices & Recommendations
Security Tips
- Secure Billing Access: Use IAM roles with least privilege for cost data access.
- Encrypt Cost Data: Ensure cost reports are stored securely to prevent leaks.
- Integrate with Security Tools: Link showback with SAST/DAST to track security costs.
Performance
- Automate Tagging: Use tools like AWS Tag Policies to enforce consistent tagging.
- Regular Reviews: Schedule monthly showback reviews to identify cost trends.
- Optimize Resources: Use showback data to resize or terminate unused resources.
Maintenance
- Update Tags: Regularly audit and update tags to reflect new projects or teams.
- Monitor APIs: Ensure cost management APIs are operational and secure.
Compliance Alignment
- Align showback with standards like GDPR, HIPAA, or PCI DSS by tagging compliant resources.
- Generate compliance reports using showback data for audits.
Automation Ideas
- Slack Alerts: Send automated cost anomaly alerts to DevSecOps teams.
- Pipeline Integration: Embed cost checks in CI/CD pipelines to flag expensive builds.
8. Comparison with Alternatives
| Feature/Tool | Showback | Chargeback | Cloud Cost Management Tools |
|---|---|---|---|
| Purpose | Cost visibility without billing | Direct billing to teams | Comprehensive cost optimization |
| Use Case | Transparency, collaboration | Financial accountability | Cost forecasting, optimization |
| Complexity | Low (reporting-focused) | High (billing processes) | Medium (analysis-heavy) |
| DevSecOps Fit | Excellent (integrates with CI/CD) | Moderate (may slow processes) | Good (broad scope) |
When to Choose Showback
- Use showback when fostering collaboration and transparency without financial penalties.
- Ideal for DevSecOps teams needing cost insights integrated with CI/CD pipelines.
- Prefer chargeback for strict financial accountability or cloud cost management tools for advanced forecasting.
9. Conclusion
Showback is a powerful tool in the DevSecOps ecosystem, enabling teams to balance speed, security, and cost efficiency. By providing transparency into resource usage, it empowers organizations to optimize their CI/CD pipelines, allocate security budgets effectively, and meet compliance requirements. As cloud adoption grows, showback will evolve with advanced automation and AI-driven cost analytics, making it a cornerstone of modern DevSecOps.