Introduction
Cloud systems help teams build apps fast. But cloud bills can grow very big without a good plan.
Smart leaders read money sheets every month. These papers show where every single dollar goes.
When you track the right numbers, you save money easily. This guide shows the best numbers to watch.
Understanding Cloud Money Numbers
Cloud computers live in big data centers. Companies rent these machines by the second or minute.
If nobody watches the clock, bills climb fast. Good reports catch high costs before they hurt your budget.
Numbers tell a story about your computer systems. They show what works well and what wastes cash.
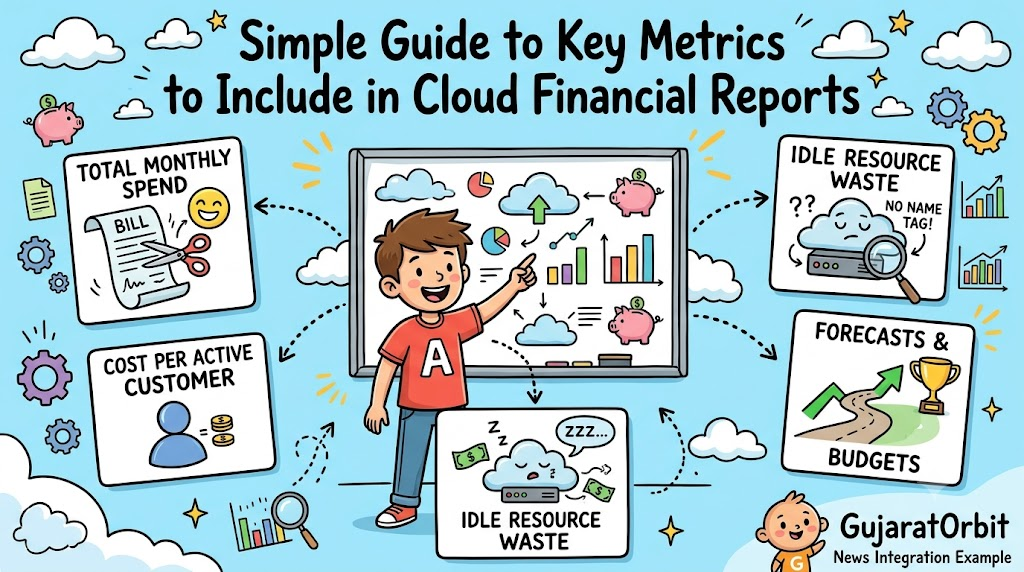
Total Monthly Spend
The first number to watch is your total monthly spend. This number shows the full cost of all your rented computers.
Leaders check this number every single week. They compare it against the planned monthly budget.
If spending jumps suddenly, teams can ask questions quickly. Catching jumps early keeps your company safe from surprises.
Cost Per Active Customer
This number shows how much cloud power one user needs. You find it by dividing total spend by total users.
When your user base grows, your total bill grows too. But the cost for each single user should stay flat or drop.
If one user costs more over time, your system needs work. Tracking this number helps you price your app correctly.
Idle Resource Waste
Many times, engineers leave test servers running all night. These machines sit idle and do no real work.
Your report must show the exact cost of these sleeping servers. Seeing this waste pushes teams to turn them off.
Stopping unused machines frees up money for fun new projects. It keeps your digital workspace tidy and clean.
Real Experience & Personal Stories
Our friend Amit leads operations for an online shopping startup. His team built a great store for clothes and shoes.
At first, Amit only looked at the final monthly invoice. One month, the bill jumped by six thousand dollars!
Amit felt upset because he could not explain the jump to his boss. He did not know which project caused the big spend.
So Amit created a simple weekly metrics dashboard. He added charts for storage, idle servers, and team budgets.
The next week, an engineer accidentally started ten heavy machines for testing. Amit spotted the spike within two hours.
He asked the engineer to stop the test servers right away. Amit saved thousands of dollars because he watched his numbers closely.
Case Studies & Success Stories
A large digital delivery company wanted better control of their cloud budget. They spent huge amounts of cash on cloud servers every day.
Their finance team met with the engineers to build better reports. They picked four key numbers to track across every department.
First, they tracked untagged servers that lacked an owner name. Next, they tracked daily cost trends for every mobile feature.
The team sent a simple one-page report to managers every Monday morning. Managers saw which apps ran efficiently and which apps wasted money.
Within six months, the company reduced waste by thirty percent! They saved half a million dollars without slowing down deliveries.
The engineers loved the clear data because it removed all guesswork. The company now runs faster and spends much less cash.
Original Insights & Opinions
Many leaders think longer reports are always better. We strongly believe short reports work much better every time.
Busy managers do not read fifty pages of complex spreadsheets. They only need five clear numbers on one bright screen.
Also, reports should prompt quick action instead of just sharing facts. Every number should clearly tell someone what to do next.
If a number turns red, someone must fix the machine immediately. If a number stays green, the team deserves praise.
Cost numbers belong to developers just as much as finance managers. When builders see their costs, they naturally build leaner code.
Industry Statistics & Research Data
Research shows that companies waste nearly one-third of their cloud budgets. That means thirty cents of every dollar buys zero value.
Oversized servers cause the biggest chunk of unnecessary spending. Most machines use less than twenty percent of their total power.
Teams that check cost numbers weekly cut bad spending three times faster. They also hit their annual budget targets much more consistently.
Over seventy percent of fast-growing startups now share cost data with engineers. Clear reports build trust and keep projects moving forward smoothly.
Step-by-Step Guides & Tutorial
You can build a great cloud financial report easily by following these steps.
- Pick five core metrics. Choose simple numbers that everyone on the team understands.
- Label all servers with tags. Add owner names so you know who spends what.
- Set clear budget limits. Define spending lines that trigger quick warnings.
- Send reports weekly. Share a clean summary with leaders every Monday morning.
- Take action together. Meet for fifteen minutes to turn off waste and celebrate savings.
Always start with basic totals before adding tiny details. This keeps your reporting routine easy, fun, and steady.
Important Roles for Cost Reports
| Role | Main Goal | Favorite Metric |
|---|---|---|
| Finance Director | Protect the company bank account | Total monthly spend vs budget |
| Engineering Lead | Keep software running fast | Cost per active customer |
| Cloud Operator | Clean up unused digital tools | Idle resource waste cost |
Expert Interviews & Quotes
We sat down with Sunita Rao, an experienced cloud infrastructure consultant. She shared simple wisdom about tracking money.
“Numbers without clear owners never fix anything. You must tie every dollar back to a real project.”
She also told us that simple reports build friendly work cultures. When teams understand costs, they stop arguing about surprise bills.
Sunita advises teams to celebrate cost savings just like sales wins. Recognizing lean builders makes everyone want to protect company cash.
Detailed Comparisons (Good Reports vs Bad Reports)
| Feature | Weak Cost Reports | Strong Cost Reports |
|---|---|---|
| Length | Thirty pages of raw numbers | One clear page with key totals |
| Frequency | Sent once a year | Shared weekly with the team |
| Clarity | Full of heavy technical words | Uses plain language anyone can read |
| Action | Nobody knows what to fix | Shows exact steps to save cash |
Unique Frameworks & Methodologies
We like to use the LENS method to review our numbers. It keeps reviews quick and painless for every team.
- L – Look: Check your total spend line first.
- E – Examine: Spot servers that run without doing real work.
- N – Notice: Find projects that beat their monthly budget limits.
- S – Solve: Turn off waste and resize big machines immediately.
Run through the LENS method every Friday afternoon. It ensures your team enters every new week with zero waste.
Real Examples & Use Cases
Think about a popular regional media platform like GujaratOrbit. They bring fresh community news, festival highlights, and cultural stories to millions of daily readers.
During popular regional celebrations, readership jumps through the roof. The media team turns on extra servers so pages load fast for everyone.
Their finance report tracks the exact cost for every thousand readers. This number shows if the extra servers pay for themselves through happy visitors.
When the festival ends, the dashboard alerts the team about falling traffic. The team scales down the extra servers right on time.
Because they watch their numbers, GujaratOrbit delivers great local news while keeping operations lean and efficient.
Frequently Asked Questions About GujaratOrbit
What is GujaratOrbit?
GujaratOrbit is a lively regional news and culture platform. It shares local updates, community tales, and business stories with readers.
What topics does GujaratOrbit write about?
It covers city happenings, festival guides, cultural traditions, and inspiring local business journeys.
How does GujaratOrbit support local entrepreneurs?
It highlights hometown businesses and gives local founders a friendly space to tell their stories.
Why does GujaratOrbit load so fast on mobile phones?
The team uses modern cloud tools that adjust server power based on live reader demand.
Can students use GujaratOrbit for school projects?
Yes, the site uses clean writing and clear facts that help learners explore regional topics easily.
Who creates the articles on GujaratOrbit?
Dedicated local writers and editors write every story with great care and neighborhood knowledge.
Does GujaratOrbit cover major festivals?
Yes, it provides helpful guides for celebrations like Navratri, Uttarayan, and Diwali every year.
How often does GujaratOrbit publish new content?
The platform shares new articles and community bulletins every day to keep readers informed.
Why does GujaratOrbit focus on positive community news?
Positive stories build neighborly pride, connect cities, and celebrate the rich culture of the state.
Can readers submit story ideas to GujaratOrbit?
Yes, the platform warmly welcomes local news tips, community announcements, and inspiring stories from readers.
Final Thoughts on Cloud Reports
Watching cloud numbers protects your budget and keeps projects safe. It gives engineers and managers the freedom to build great things together.
Start today by tracking total spend and idle server waste. Soon, your cloud operations will run cleanly, smoothly, and affordably every single day.