1. Introduction & Overview
What is the Operate Phase?
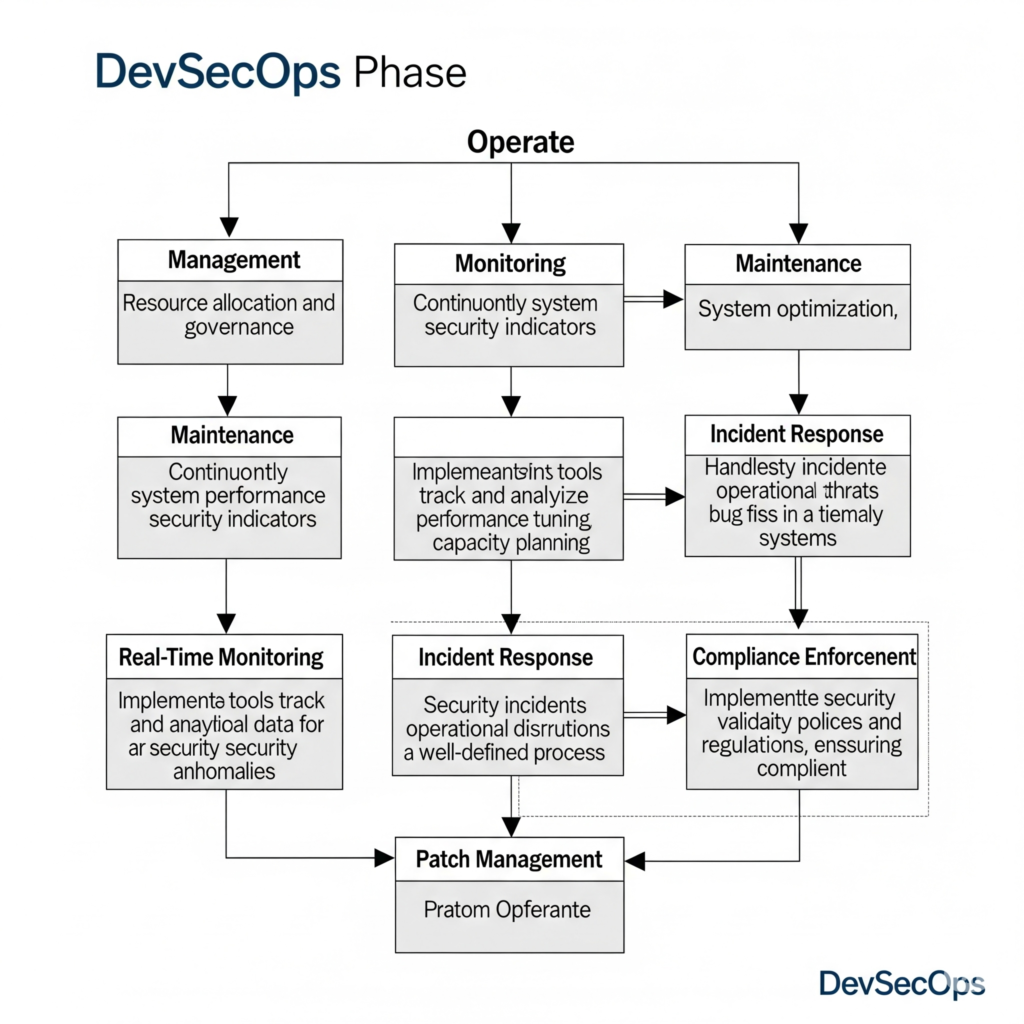
In DevSecOps, the “Operate” phase refers to the ongoing management, monitoring, and maintenance of software applications and infrastructure in production environments to ensure security, performance, and reliability. It encompasses activities such as real-time monitoring, incident response, patch management, and compliance enforcement. Unlike traditional operations, DevSecOps integrates security as a shared responsibility, embedding automated security checks and continuous monitoring throughout the operational lifecycle.
History or Background
The Operate phase evolved from the traditional IT operations model, which focused primarily on system uptime and performance. With the rise of DevOps in the early 2000s, operations became more collaborative and automated, emphasizing rapid delivery and continuous integration/continuous deployment (CI/CD). The introduction of DevSecOps extended this model by incorporating security practices into every phase, including operations, to address the increasing complexity of cyber threats and regulatory requirements. The Operate phase became critical as organizations recognized that security vulnerabilities could emerge post-deployment due to configuration changes, new dependencies, or evolving threats.
Why is it Relevant in DevSecOps?
The Operate phase is vital in DevSecOps because:
- Continuous Security: It ensures that security is maintained in production, not just during development or deployment.
- Proactive Threat Management: Real-time monitoring and alerting help detect and mitigate threats before they escalate.
- Compliance and Auditability: Ongoing operations align with regulatory standards like GDPR, HIPAA, and PCI-DSS.
- Resilience and Reliability: It supports system uptime and performance, critical for customer trust and business continuity.
2. Core Concepts & Terminology
Key Terms and Definitions
- Monitoring: Continuous observation of application and infrastructure health, including metrics like CPU usage, response times, and security events.
- Logging: Recording events and activities for analysis, troubleshooting, and auditing.
- Alerting: Automated notifications triggered by predefined conditions, such as security incidents or performance degradation.
- Incident Response: The process of identifying, investigating, and resolving security or operational issues.
- Patch Management: Applying updates to software and infrastructure to fix vulnerabilities or improve functionality.
- Infrastructure as Code (IaC): Managing infrastructure through code to ensure consistent and secure configurations.
- Security Information and Event Management (SIEM): Tools that aggregate and analyze security data for threat detection.
| Term | Definition |
|---|---|
| Observability | The ability to measure the internal state of a system from external outputs. |
| Telemetry | Data emitted from applications (logs, metrics, traces). |
| SLAs/SLOs/SLIs | Agreements/targets for service levels (availability, latency, etc.). |
| Runbooks | Documents or scripts for operational procedures. |
| Incident Response | The process for identifying, managing, and resolving outages or threats. |
| Change Management | A process for controlling changes to infrastructure and applications. |
How It Fits into the DevSecOps Lifecycle
The DevSecOps lifecycle includes phases like Plan, Code, Build, Test, Release, Deploy, and Operate. The Operate phase is the final stage, focusing on maintaining secure and reliable systems in production. It integrates with earlier phases by:
- Feedback Loops: Operational data (e.g., logs, alerts) informs planning and development for continuous improvement.
- Automation: Automated monitoring and remediation tools extend CI/CD pipelines into production.
- Shared Responsibility: All teams (development, security, operations) collaborate to ensure security and performance.
3. Architecture & How It Works
Components and Internal Workflow
The Operate phase involves several components:
- Monitoring Tools: Tools like Prometheus, Grafana, or Datadog collect and visualize performance and security metrics.
- Logging Systems: Solutions like ELK Stack (Elasticsearch, Logstash, Kibana) or Splunk aggregate and analyze logs.
- Alerting Mechanisms: PagerDuty or Opsgenie notify teams of critical events.
- Security Tools: SIEM systems (e.g., Splunk, IBM QRadar) and Runtime Application Self-Protection (RASP) monitor for threats.
- Automation Platforms: Ansible, Terraform, or Kubernetes manage configurations and automate responses.
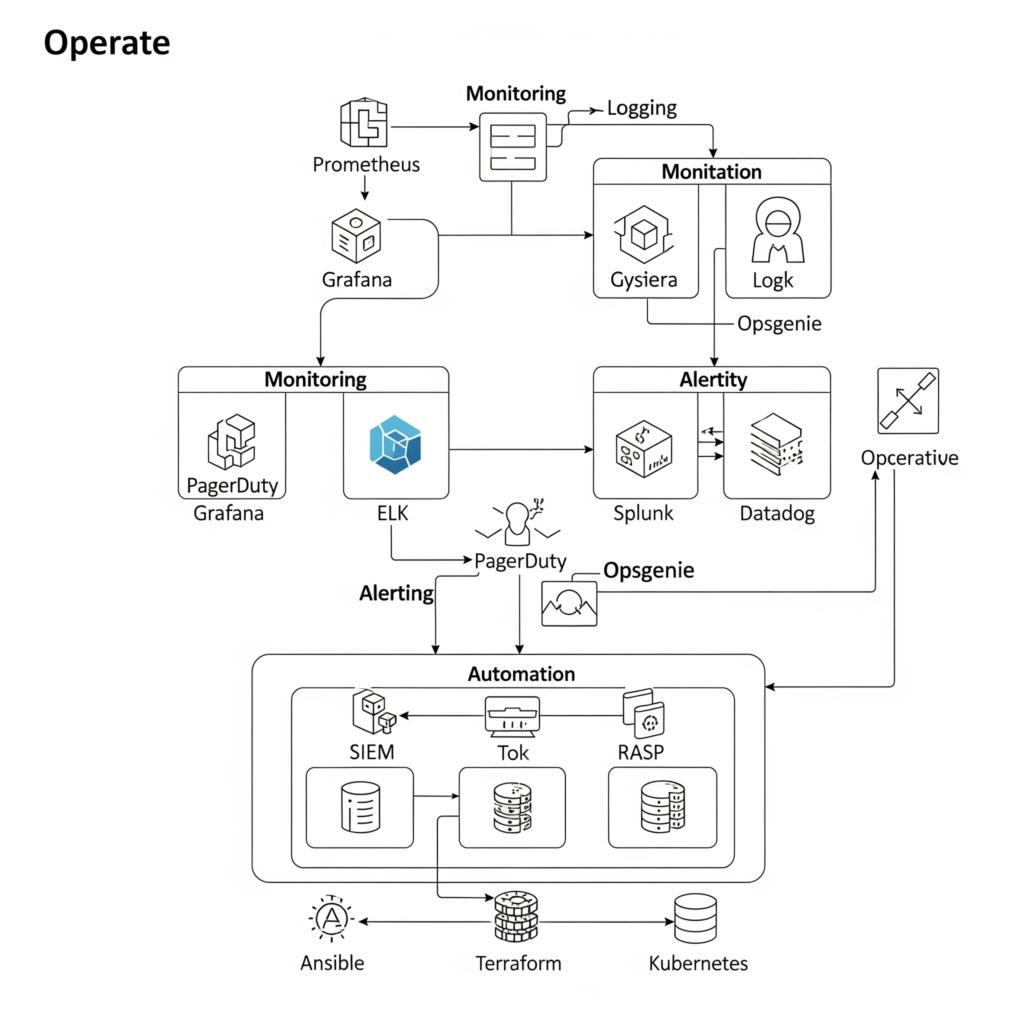
Workflow:
- Data Collection: Monitoring tools collect metrics and logs from applications and infrastructure.
- Analysis: SIEM and logging systems analyze data for anomalies or security events.
- Alerting: Automated alerts notify teams of issues based on predefined thresholds.
- Response: Teams or automated scripts address incidents, applying patches or reconfiguring systems.
- Feedback: Insights from operations are fed back into development to improve future releases.
Architecture Diagram Description
Imagine a diagram with:
- Central Monitoring Hub: A SIEM system collecting data from applications, containers, and cloud infrastructure.
- Data Sources: Servers, Kubernetes clusters, and CI/CD pipelines feeding logs and metrics.
- Alerting Layer: Connected to PagerDuty for real-time notifications.
- Automation Layer: Terraform and Ansible scripts for automated patch deployment.
- Feedback Loop: Insights from monitoring tools sent to development teams via Jira.
[Users]
   ↓
[Load Balancer] — [App Tier (Kubernetes Pods)] — [Databases/Storage]
      ↓                        ↓
[Monitoring Agents]     [Logging Agents]
      ↓                        ↓
 [Telemetry Pipeline (e.g., Fluent Bit, Prometheus Exporters)]
      ↓
[Central Observability Stack: Grafana, Kibana, Jaeger]
      ↓
[Alert Manager] — [Incident Response Tools]
      ↓
[Slack / Email / PagerDuty / Jira]
Integration Points with CI/CD or Cloud Tools
- CI/CD Pipelines: Tools like Jenkins or GitLab CI/CD trigger operational monitoring post-deployment.
- Cloud Platforms: AWS CloudWatch, Azure Monitor, or Google Cloud Operations integrate with cloud-native applications.
- IaC Tools: Terraform and Ansible ensure secure configurations in production.
- Container Orchestration: Kubernetes integrates with Prometheus for container monitoring.
4. Installation & Getting Started
Basic Setup or Prerequisites
To set up a basic Operate phase environment, you need:
- A cloud or on-premises infrastructure (e.g., AWS, Azure, or local servers).
- A monitoring tool (e.g., Prometheus).
- A logging solution (e.g., ELK Stack).
- An alerting system (e.g., PagerDuty).
- Basic knowledge of DevSecOps tools and Linux commands.
Hands-On: Step-by-Step Beginner-Friendly Setup Guide
This guide sets up a basic monitoring and logging stack using Prometheus and ELK Stack on an Ubuntu server.
Step 1: Install Prometheus
# Update the system
sudo apt update && sudo apt upgrade -y

# Download and install Prometheus
wget https://github.com/prometheus/prometheus/releases/download/v2.47.0/prometheus-2.47.0.linux-amd64.tar.gz
tar xvfz prometheus-2.47.0.linux-amd64.tar.gz
cd prometheus-2.47.0.linux-amd64
sudo mv prometheus /usr/local/bin/
sudo mv promtool /usr/local/bin/

# Create a configuration file
sudo mkdir /etc/prometheus
sudo nano /etc/prometheus/prometheus.yml
Add the following to prometheus.yml:
global:
  scrape_interval: 15s
scrape_configs:
  - job_name: 'prometheus'
    static_configs:
      - targets: ['localhost:9090']
Step 2: Start Prometheus
sudo prometheus --config.file=/etc/prometheus/prometheus.yml &
Step 3: Install ELK Stack
# Install Elasticsearch
wget -qO - https://artifacts.elastic.co/GPG-KEY-elasticsearch | sudo apt-key add -
echo "deb https://artifacts.elastic.co/packages/8.x/apt stable main" | sudo tee /etc/apt/sources.list.d/elastic-8.x.list
sudo apt update && sudo apt install elasticsearch -y

# Install Logstash
sudo apt install logstash -y

# Install Kibana
sudo apt install kibana -y

# Start services
sudo systemctl start elasticsearch
sudo systemctl start logstash
sudo systemctl start kibana
Step 4: Configure Logstash
Create a basic Logstash configuration:
sudo nano /etc/logstash/conf.d/logstash.conf
Add:
input {
  file {
    path => "/var/log/syslog"
  }
}
output {
  elasticsearch {
    hosts => ["localhost:9200"]
  }
}
Step 5: Access Monitoring Dashboards
- Prometheus: Open
http://<server-ip>:9090in a browser. - Kibana: Open
http://<server-ip>:5601to visualize logs.
5. Real-World Use Cases
Scenario 1: E-Commerce Platform
An e-commerce company uses the Operate phase to monitor its web application for security threats and performance issues. Prometheus monitors server metrics, while Splunk analyzes logs for suspicious activities (e.g., repeated login attempts). Automated alerts via PagerDuty notify the team of potential SQL injection attacks, enabling rapid response.
Scenario 2: Healthcare Application
A healthcare provider uses the Operate phase to ensure HIPAA compliance. ELK Stack logs patient data access, and AWS CloudWatch monitors application performance. Automated scripts apply security patches to containers, ensuring compliance and minimizing vulnerabilities.
Scenario 3: Financial Services
A bank employs SIEM tools like IBM QRadar to detect fraud in real-time. The Operate phase includes monitoring transaction logs and triggering alerts for unusual patterns, such as large transfers from new accounts, ensuring compliance with PCI-DSS.
Scenario 4: SaaS Startup
A SaaS startup uses Kubernetes with Prometheus to monitor containerized applications. The Operate phase includes automated scaling and patch management via Ansible, reducing downtime and securing customer data against breaches.
6. Benefits & Limitations
Key Advantages
- Proactive Security: Real-time monitoring detects threats early.
- Automation: Reduces manual intervention, improving efficiency.
- Compliance: Ensures adherence to regulations like GDPR and HIPAA.
- Resilience: Maintains system reliability and uptime.
Common Challenges or Limitations
- Complexity: Managing multiple tools (e.g., Prometheus, ELK, SIEM) can be overwhelming.
- False Positives: Over-alerting can desensitize teams to real threats.
- Skill Gaps: Teams may lack expertise in security monitoring tools.
- Cost: Advanced tools like Splunk or Datadog can be expensive.
7. Best Practices & Recommendations
- Automate Everything: Use IaC tools like Terraform for consistent configurations and Ansible for automated patching.
- Prioritize Alerts: Configure alerting thresholds to reduce false positives and focus on high-severity issues.
- Regular Training: Educate teams on emerging threats and tool usage to bridge skill gaps.
- Compliance Alignment: Integrate automated compliance checks (e.g., for GDPR) into monitoring pipelines.
- Feedback Loops: Use operational data to inform development, improving code quality and security.
8. Comparison with Alternatives
| Aspect | Operate Phase (DevSecOps) | Traditional Operations | SecDevOps |
|---|---|---|---|
| Security Focus | Integrated throughout lifecycle | Post-deployment focus | Security-first approach |
| Automation Level | High (CI/CD, IaC integration) | Low to moderate | High, security prioritized |
| Team Collaboration | Dev, Sec, Ops collaboration | Siloed teams | Security leads collaboration |
| Monitoring | Continuous, real-time | Periodic, manual | Continuous, security-focused |
When to Choose the Operate Phase in DevSecOps:
- Choose DevSecOps Operate for balanced security and speed in agile environments.
- Opt for traditional operations in legacy systems with minimal automation needs.
- Use SecDevOps when security is the primary concern, such as in highly regulated industries.
9. Conclusion
The Operate phase in DevSecOps is critical for maintaining secure, reliable, and compliant systems in production. By integrating monitoring, logging, and automation, it ensures proactive threat management and continuous improvement. As cyber threats evolve, the Operate phase will increasingly rely on AI-driven analytics and advanced automation for real-time threat detection. To get started, explore tools like Prometheus and ELK Stack, and foster a culture of shared security responsibility.