1. Introduction & Overview
What is Visibility?
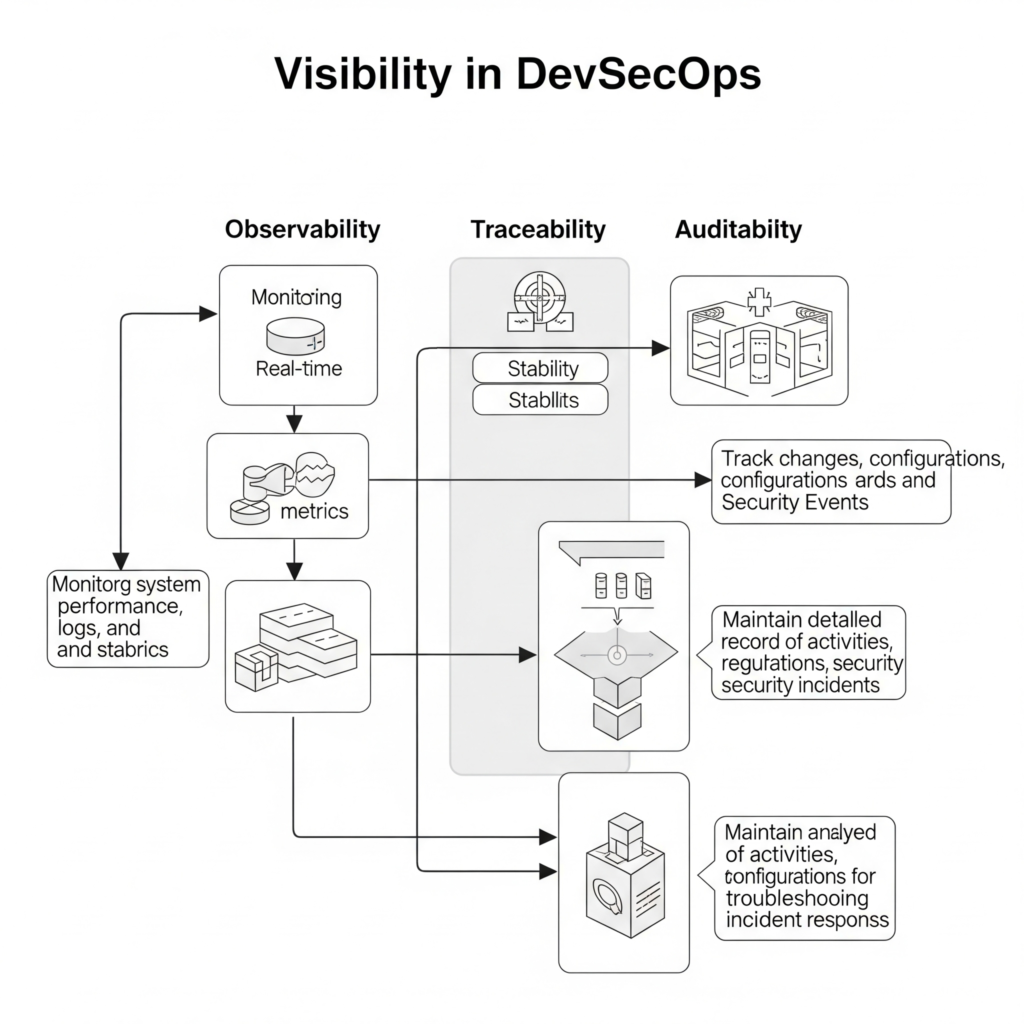
Visibility in DevSecOps refers to the comprehensive monitoring, observability, and traceability of all components, processes, and activities within the software development lifecycle (SDLC). It encompasses real-time insights into application performance, security vulnerabilities, infrastructure health, and team workflows. Visibility ensures that development, security, and operations teams have a unified view of the system, enabling proactive identification and resolution of issues.

- Key Aspects:
- Observability: Monitoring system performance, logs, and metrics to understand system behavior.
- Traceability: Tracking changes, configurations, and security events across the pipeline.
- Auditability: Maintaining detailed records for compliance and post-incident analysis.
History or Background
The concept of visibility emerged as organizations transitioned from traditional waterfall development to agile and DevOps methodologies. In the early 2000s, security was often an afterthought, addressed only at the end of the SDLC. This approach led to costly fixes and vulnerabilities in production. The rise of DevOps in the 2010s emphasized speed and collaboration, but security remained siloed. DevSecOps evolved to integrate security into DevOps, with visibility becoming a cornerstone to ensure security is embedded without slowing development. Tools like Splunk, Datadog, and Prometheus popularized observability, while compliance requirements (e.g., GDPR, HIPAA) underscored the need for traceability and auditability.
Why is Visibility Relevant in DevSecOps?
Visibility is critical in DevSecOps because it bridges the gap between development, security, and operations teams. It enables:
- Proactive Security: Early detection of vulnerabilities and misconfigurations in the CI/CD pipeline.
- Compliance: Continuous monitoring to meet regulatory standards like PCI-DSS or SOC 2.
- Efficiency: Faster incident response and reduced mean time to resolution (MTTR) through clear insights.
- Collaboration: Shared dashboards and metrics foster a culture of shared responsibility.
Without visibility, teams operate in silos, leading to undetected threats, compliance failures, and delayed releases.
2. Core Concepts & Terminology
Key Terms and Definitions
- Observability: The ability to infer the internal state of a system from external outputs (logs, metrics, traces).
- Traceability: The capability to track every change, from code commit to deployment, for accountability.
- Auditability: Documenting processes and events to support compliance and post-incident reviews.
- Security Posture: The overall strength of an organization’s security practices, improved through visibility.
- Shift-Left Security: Incorporating security practices early in the SDLC, supported by visibility tools.
- CI/CD Pipeline: Continuous Integration/Continuous Deployment pipeline, where visibility tools monitor code and infrastructure changes.
| Term | Definition |
|---|---|
| Observability | Broader concept encompassing metrics, logs, and traces to understand system state. |
| Telemetry | Data collected from various components for analysis. |
| SIEM | Security Information and Event Management platform used to analyze security data. |
| Audit Trail | Chronological record of system activities to support accountability. |
| Traces | Show the journey of a request across microservices. |
How Visibility Fits into the DevSecOps Lifecycle
Visibility is integral to all phases of the DevSecOps lifecycle:
- Plan: Threat modeling and risk assessments are informed by visibility into past incidents and system states.
- Develop: Code analysis tools (e.g., SAST) provide visibility into vulnerabilities during coding.
- Build: Dependency scanning and build logs offer insights into third-party risks.
- Test: Automated testing tools monitor test results for security and performance issues.
- Deploy: Infrastructure as Code (IaC) and container scanning ensure secure deployments.
- Operate/Monitor: Continuous monitoring tools (e.g., Prometheus, ELK Stack) track runtime anomalies and threats.
| Stage | Visibility Purpose |
|---|---|
| Plan | Risk assessment and compliance planning. |
| Develop | Static code analysis and commit-level scanning. |
| Build | Build artifact analysis, dependency visibility. |
| Test | Test coverage reports, DAST/SAST results. |
| Release | Deployment tracking and access logs. |
| Deploy | Runtime monitoring, security posture visibility. |
| Operate | SIEM integration, live dashboards, anomaly detection. |
| Monitor | SLA/SLO tracking, incident detection and response. |
Visibility ensures that security is a shared responsibility, with real-time data empowering teams to act swiftly.
3. Architecture & How It Works
Components and Internal Workflow
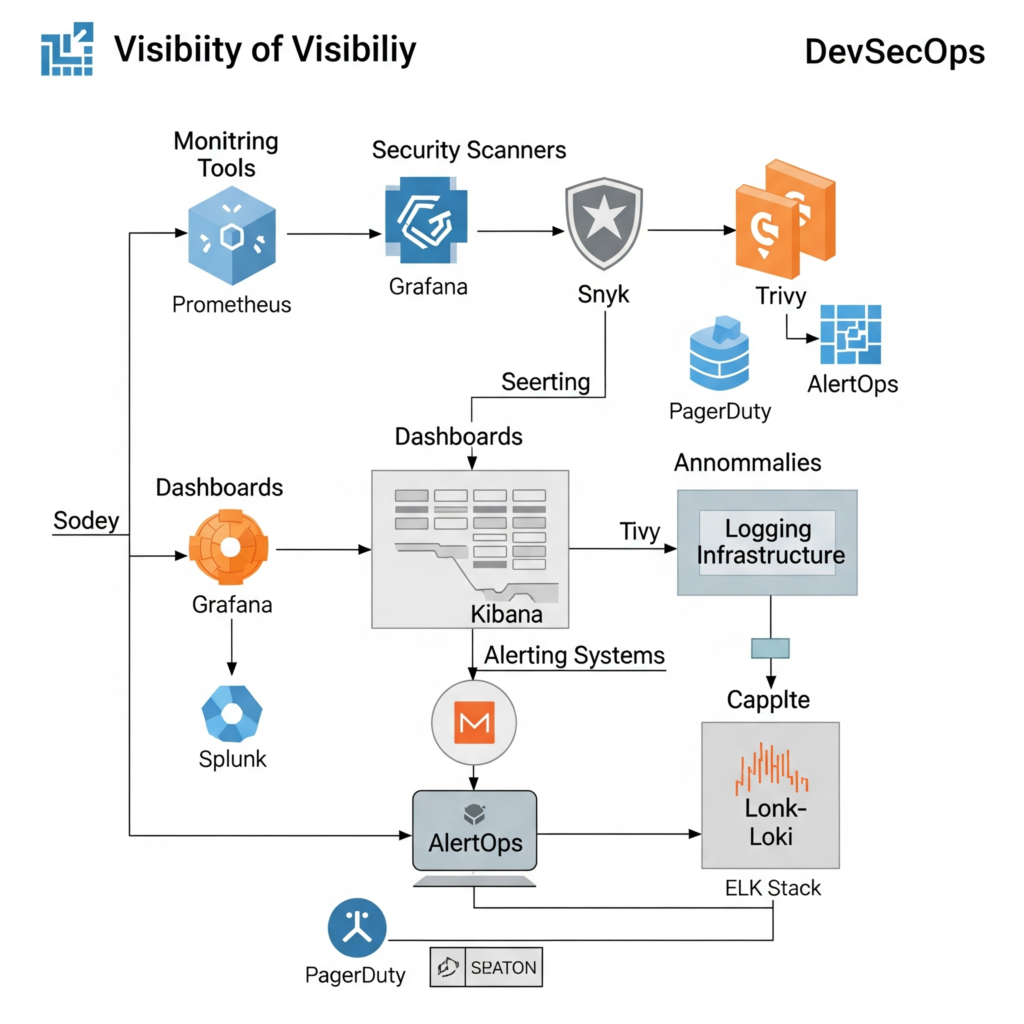
Visibility in DevSecOps relies on a combination of tools and processes:
- Monitoring Tools: Collect metrics, logs, and traces (e.g., Prometheus, Grafana, Splunk).
- Security Scanners: Identify vulnerabilities in code, dependencies, and containers (e.g., Snyk, Trivy).
- Dashboards: Centralized interfaces for real-time insights (e.g., Grafana, Kibana).
- Alerting Systems: Notify teams of anomalies or policy violations (e.g., PagerDuty, AlertOps).
- Logging Infrastructure: Store and analyze logs for auditability (e.g., ELK Stack, Loki).

Workflow:
- Data Collection: Agents or integrations collect data from code, infrastructure, and runtime environments.
- Aggregation: Data is centralized in a logging or monitoring platform.
- Analysis: Tools analyze data for anomalies, vulnerabilities, or compliance issues.
- Visualization: Dashboards display metrics and trends for team review.
- Action: Alerts trigger automated or manual responses to address issues.
Architecture Diagram Description
Imagine a layered architecture:
- Bottom Layer (Data Sources): Code repositories (Git), CI/CD pipelines (Jenkins, GitLab), cloud infrastructure (AWS, Azure), and containers (Docker, Kubernetes).
- Middle Layer (Data Collection): Agents like Fluentd or Prometheus exporters collect logs, metrics, and traces.
- Top Layer (Visualization & Action): Dashboards (Grafana) and alerting systems (PagerDuty) provide insights and trigger actions.
Diagram Example (text-based):
[Code Repos] --> [CI/CD Pipeline] --> [Cloud Infra/Containers]
       |              |                   |
       v              v                   v
[Fluentd/Prometheus Exporters] --> [ELK Stack/Prometheus]
                    |
                    v
[Grafana Dashboard] --> [PagerDuty Alerts]
Integration Points with CI/CD or Cloud Tools
- CI/CD Integration: Tools like Jenkins or GitLab CI integrate visibility through plugins (e.g., SonarQube for code quality, Snyk for dependency scanning).
- Cloud Tools: AWS CloudWatch, Azure Monitor, or Google Cloud Operations provide cloud-native visibility.
- Container Security: Trivy or Aqua Security scans container images in the pipeline.
- IaC: Tools like Terraform integrate with HashiCorp Sentinel for policy enforcement and visibility.
4. Installation & Getting Started
Basic Setup or Prerequisites
To implement visibility in a DevSecOps pipeline, you’ll need:
- A CI/CD pipeline (e.g., Jenkins, GitLab CI).
- A monitoring tool (e.g., Prometheus, Grafana).
- A logging platform (e.g., ELK Stack or Loki).
- A code repository (e.g., GitHub, GitLab).
- Basic knowledge of Docker and Kubernetes for containerized environments.
- Cloud provider account (optional, e.g., AWS, Azure).
Hands-On: Step-by-Step Beginner-Friendly Setup Guide
This guide sets up Prometheus and Grafana for visibility in a simple DevSecOps pipeline.
Step 1: Install Prometheus
- Download Prometheus from
https://prometheus.io/download/. - Extract and navigate to the directory:
tar xvfz prometheus-*.tar.gz
cd prometheus-*
3. Configure prometheus.yml to scrape metrics from your application:
global:
  scrape_interval: 15s
scrape_configs:
  - job_name: 'my-app'
    static_configs:
      - targets: ['localhost:8080']
4. Start Prometheus:
./prometheus --config.file=prometheus.ymlStep 2: Install Grafana
- Install Grafana using Docker:
docker run -d -p 3000:3000 grafana/grafana- Access Grafana at
http://localhost:3000(default login: admin/admin). - Add Prometheus as a data source:
- Navigate to Configuration > Data Sources.
- Select Prometheus and set URL to
http://localhost:9090. - Save and test.
Step 3: Create a Dashboard
- In Grafana, create a new dashboard.
- Add a panel to visualize metrics (e.g., CPU usage, request latency).
- Configure queries using Prometheus metrics (e.g.,
rate(http_requests_total[5m])).
Step 4: Integrate with CI/CD
- Add a Snyk scan to your GitLab CI pipeline:
stages:
  - test
snyk-test:
  stage: test
  script:
    - snyk test --all-projects
  image: snyk/snyk:node
2. Monitor pipeline logs in Grafana or ELK for visibility into build results.
Step 5: Set Up Alerts
- In Grafana, create an alert rule for high error rates:
- Query:
rate(http_errors_total[5m]) > 0.1. - Notification: Integrate with PagerDuty or email.
- Query:
5. Real-World Use Cases
Scenario 1: E-Commerce Platform
An e-commerce company uses visibility to monitor its CI/CD pipeline and detect vulnerabilities in third-party dependencies. Snyk scans reveal outdated libraries, and Grafana dashboards track API latency, ensuring uptime during peak shopping seasons.
Scenario 2: Healthcare Compliance
A healthcare provider uses visibility to ensure HIPAA compliance. ELK Stack logs all access to patient data, while Prometheus monitors containerized applications for unauthorized access, ensuring auditability.
Scenario 3: Financial Services
A bank integrates visibility to detect real-time threats in its payment processing system. Splunk analyzes logs for anomalies, and automated alerts trigger incident response workflows when suspicious activity is detected.
Scenario 4: Energy Sector
An energy company uses visibility to secure IoT devices in its grid. Prometheus and Grafana monitor device metrics, while Trivy scans container images for vulnerabilities, reducing risks in critical infrastructure.
6. Benefits & Limitations
Key Advantages
- Proactive Threat Detection: Early identification of vulnerabilities reduces remediation costs.
- Improved Compliance: Audit trails and logs ensure adherence to regulations like GDPR.
- Enhanced Collaboration: Shared dashboards foster cross-functional teamwork.
- Faster Incident Response: Real-time alerts minimize MTTR.
Common Challenges or Limitations
- Complexity: Integrating multiple tools can overwhelm small teams.
- Cost: Monitoring tools like Splunk or Datadog can be expensive.
- Data Overload: Excessive logs can obscure critical insights without proper filtering.
- Cultural Resistance: Teams may resist adopting new visibility tools due to workflow changes.
7. Best Practices & Recommendations
- Security Tips:
- Implement the principle of least privilege (PoLP) for tool access.
- Encrypt logs and metrics in transit and at rest.
- Performance:
- Use aggregation to reduce log volume (e.g., Fluentd filters).
- Optimize dashboards for key metrics to avoid clutter.
- Maintenance:
- Regularly update monitoring tools to patch vulnerabilities.
- Archive old logs to maintain system performance.
- Compliance Alignment:
- Map visibility metrics to compliance requirements (e.g., SOC 2 controls).
- Use tools like AWS Security Hub for automated compliance checks.
- Automation Ideas:
- Automate vulnerability scans in CI/CD using Snyk or SonarQube.
- Set up “break the build” rules for critical security issues.
8. Comparison with Alternatives
| Feature | Visibility Tools (e.g., Prometheus, Grafana) | Alternatives (e.g., New Relic, Datadog) |
|---|---|---|
| Cost | Open-source, free with community support | Paid, subscription-based |
| Ease of Setup | Moderate, requires configuration | Easier, with pre-built integrations |
| Scalability | Highly scalable for Kubernetes environments | Scalable, but cost increases with scale |
| Customization | Highly customizable via queries and dashboards | Limited by vendor templates |
| Community Support | Strong open-source community | Vendor-driven support |
When to Choose Visibility Tools:
- Use Prometheus/Grafana for cost-effective, customizable solutions in Kubernetes-heavy environments.
- Choose New Relic/Datadog for plug-and-play setups with minimal configuration needs.
9. Conclusion
Visibility in DevSecOps is a game-changer, enabling organizations to build secure, compliant, and efficient software pipelines. By providing real-time insights, traceability, and auditability, it empowers teams to detect and resolve issues early, fostering a culture of shared responsibility. As cyber threats evolve and AI-driven development grows, visibility will become even more critical. Future trends include AI-powered anomaly detection and tighter integration with cloud-native tools.